
Minimum Burden as the Control Variable
Traditionally, burden is measured as the minimum distance from a borehole to the free face along a vertical profile. However, this approach becomes unreliable in complex conditions such as corner holes or highly irregular bench faces.
A more advanced method uses a spherical search around each borehole to determine the true minimum distance to the surface, independent of direction. The result is a minimum burden diagram that accurately captures real bench conditions. Compared to conventional profile-based methods, the difference can be substantial (Figure 2).
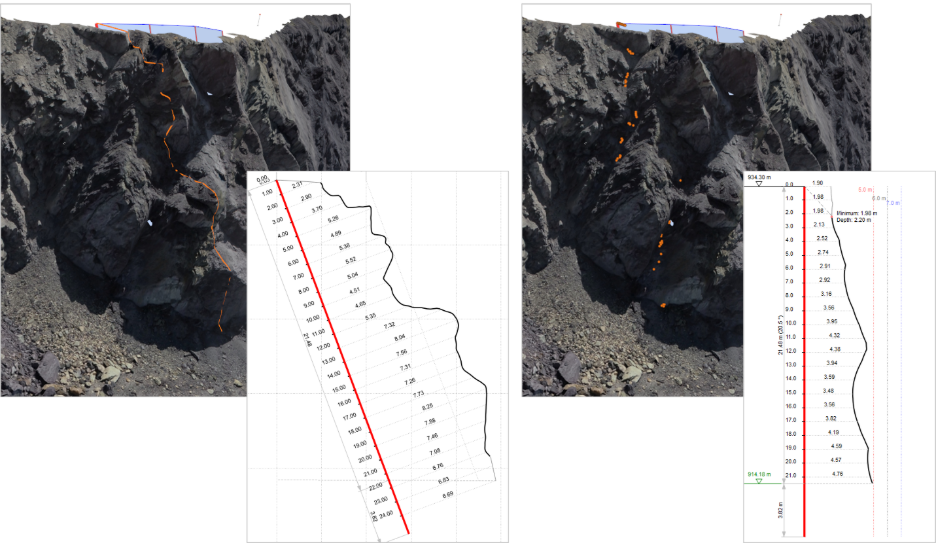
Figure 2: Profile (left) vs minimum burden diagram (right). The overestimation of burden in the profile can be significant, up to several meters in complex geometries.
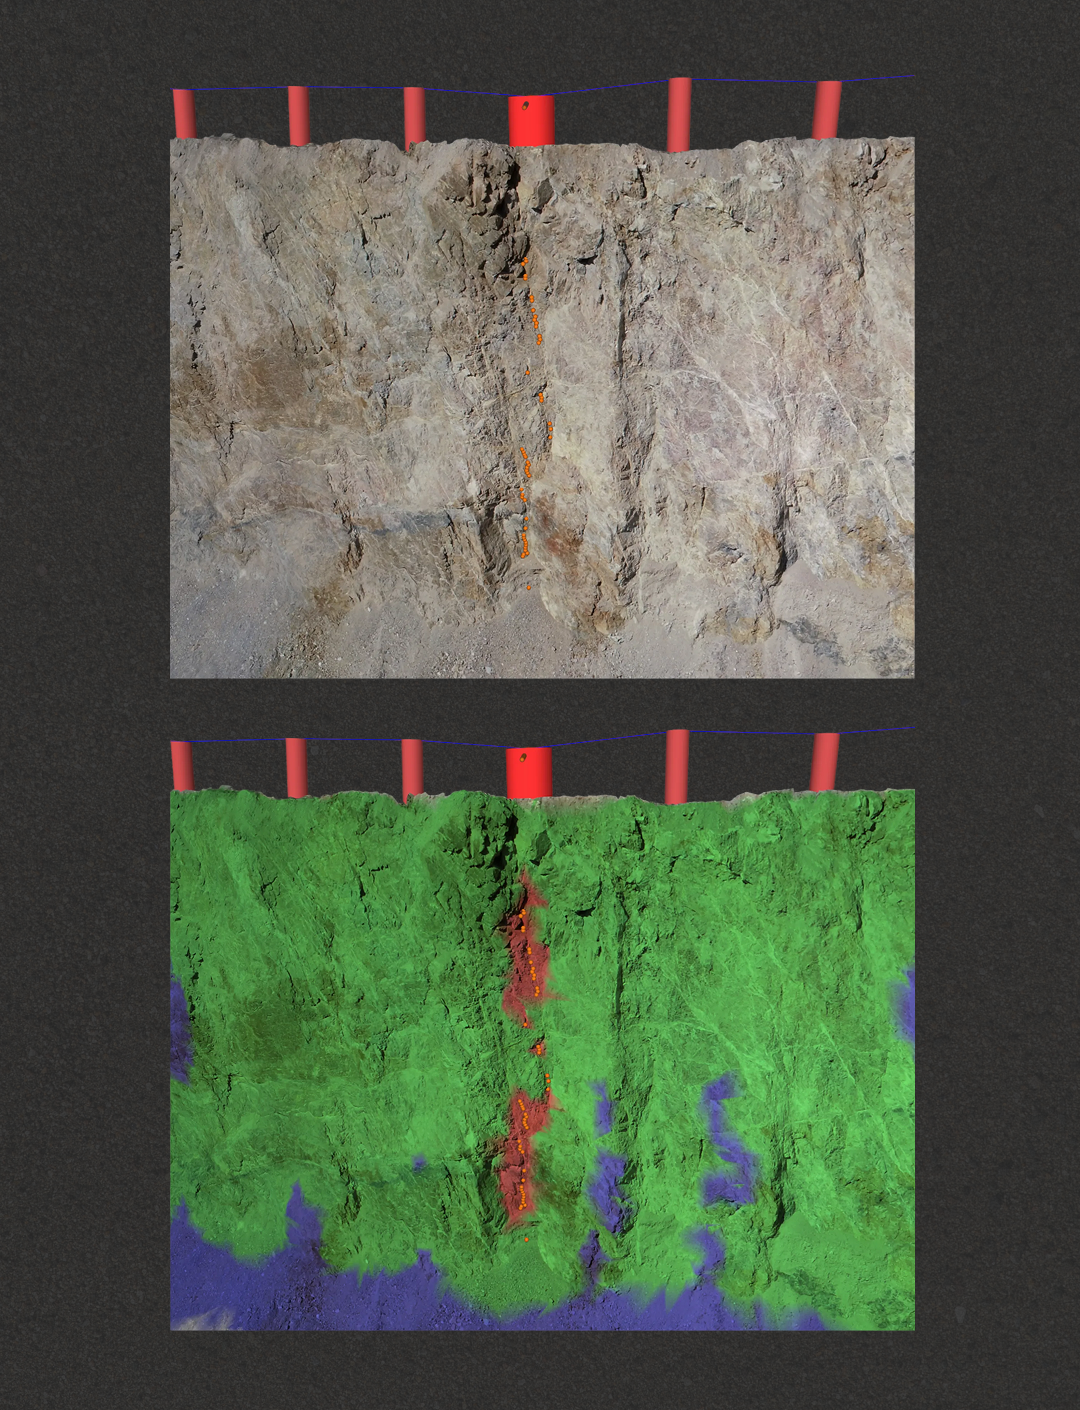
To further enhance insight, burden is also calculated from the surface to the nearest borehole and visualized as a heat map directly on the 3D model. This instantly highlights deviations from the design burden, allowing engineers to identify critical zones at a glance (Figure 3).
Because the system updates in real time, any change in borehole position or inclination is immediately reflected in the burden distribution. This enables rapid optimization of the drill pattern until a safe and efficient configuration is achieved (Figure 4).
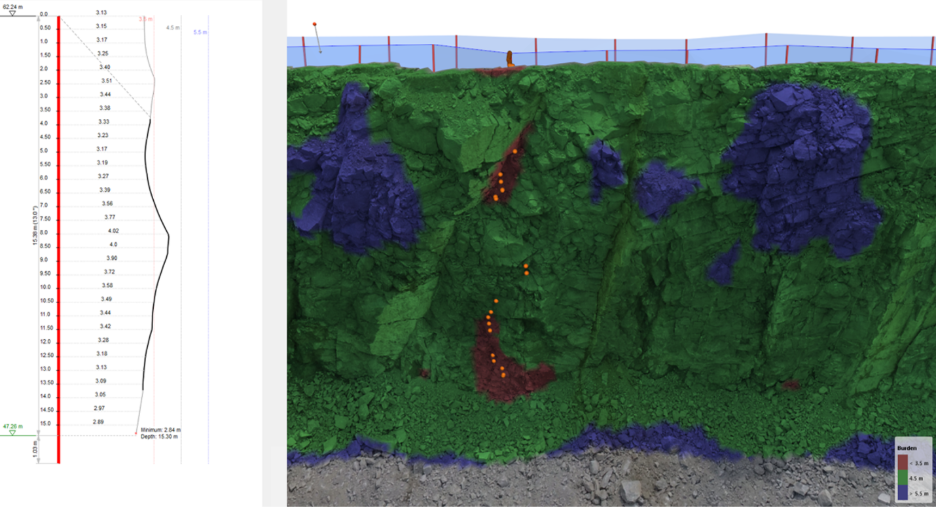
Figure 3. The colour coded visualization of burden over the entire face facilitates the identification of light burden zones. Green: design burden; Red: light burden; Blue: heavy burden. For each borehole a minimum burden profile is immediately available
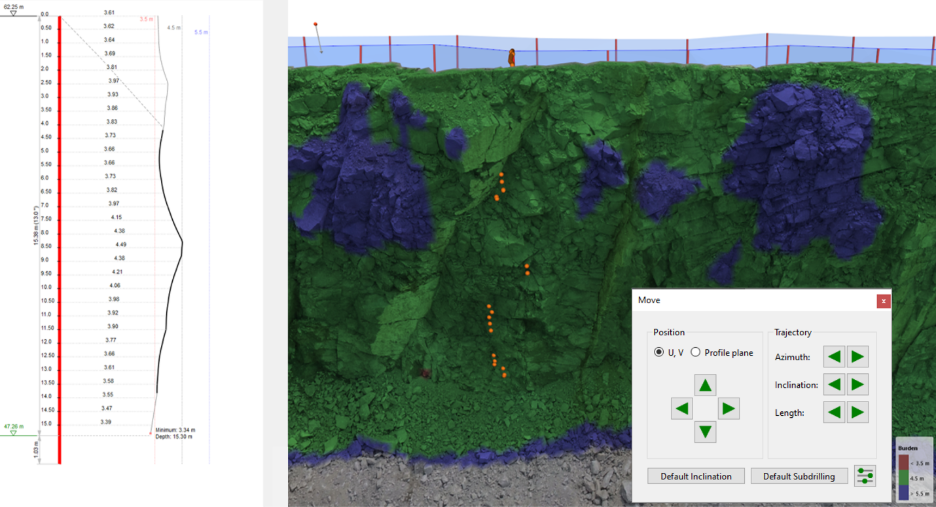
Figure 4: Adaptation of the drill pattern at critical locations through relocation of boreholes and/or adjustment of their inclination and azimuth. This process can also be supported by algorithmic (automated) methods.
The Geometry-Controlled Blast Design Workflow
The methodology follows a systematic sequence designed to maximize geometric control throughout the blast cycle:
Step 1: Pre-Drill 3D Image Acquisition
Generate the 3D image before staking or drilling boreholes.
Step 2: Establish Base Drill Pattern
Specify the intended drill pattern parameters: burden, spacing, hole inclination and azimuth, sub-drilling depth, and row offset. This pattern serves as the starting template for optimization.
Step 3: Interactive 3D Inspection
Review the drill pattern overlaid on the bench face in three dimensions. The software provides continuous burden visualization across the entire face, colour-coded to immediately reveal zones of excessive or insufficient burden.
Step 4: Optimize Hole Locations
Relocate individual boreholes and modify their inclination or azimuth based on actual bench irregularities. This step represents the central optimization step. Any modification to borehole position or orientation updates the burden distribution in real time, enabling iterative refinement of the drill pattern until an optimal configuration is achieved.
Step 5: Field Layout
Stake the planned, optimized drill pattern. This step can also be completed by sending the drill pattern information to a smart drill rig that can execute the pattern accordingly. The exported coordinates reflect geometry-adapted hole positions.
Step 6: Drilling Execution
Drill according to the staked pattern.
Step 7: Deviation Survey and Model Update (Optional)
For maximum accuracy, survey actual collar positions and downhole trajectories using deviation probes. This step captures the as-built reality, which often differs significantly from the planned layout due to drilling tolerances and geological steering.
Integrate surveyed borehole data into the blast model. This updates all profiles, cross-sectional areas, and minimum burden calculations to reflect actual rather than intended geometry.
Step 8: Loading Optimization
Check the final burden situation and use it for loading the holes. This ensures explosive distribution matches the true rock mass to be displaced.
Measured Economic Impact
Field validation in a distinct quarry operation quantified the benefits of routine 3D imaging for blast design:
- Drilling geometry increased by 15% (burden and spacing), reducing drilling effort by approximately 10%.
- Fragmentation quality improved based on visual assessment.
- Boulder reduction costs decreased.
- Specific explosive consumption decreased by 9%.
- Crusher electricity consumption decreased by 16%.
- Crusher throughput increased by 8%.
These results stem from two mechanisms: eliminating unnecessary holes through larger sustainable patterns, and precise explosive distribution matching actual burden conditions.
Implementation Considerations
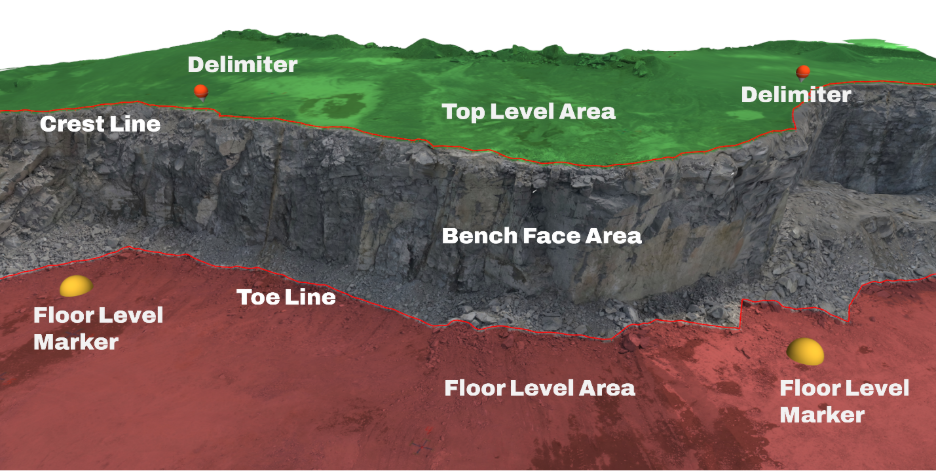
The system requires minimal specialized equipment. Image acquisition is carried out using drone-based cameras, enabling fast, safe, and comprehensive capture of the entire bench geometry, including hard-to-reach areas. High-resolution UAV imagery provides sufficient detail for accurate 3D reconstruction without requiring advanced photogrammetric expertise.
Field acquisition is completed within 30 – 60 minutes, while processing can be performed efficiently on standard hardware. The resulting model provides immediate access to key parameters such as bench face height, width, mean inclination, and recommended hole inclination based on the actual face angle, along with detailed burden information across the entire pattern.
The system outputs scaled plan views, profile drawings, minimum burden diagrams for every hole, burden visualization maps, and the 3D image itself, providing a complete and intuitive form of documentation.
Conclusions
Improving drill pattern design and shot hole loading requires a shift from assumed geometry to measured reality. 3D imaging provides a complete representation of the bench face, enabling drill patterns to be adapted to actual conditions before drilling begins.
The introduction of minimum burden as the governing parameter for loading marks a critical advancement. Unlike conventional profiles, it captures the true confinement conditions controlling explosive performance.
This approach transforms blast design from a fixed grid into a responsive system, where each hole reflects local geometry and rock conditions. The result is tighter control over energy distribution, reduced risk, and measurable improvements across the production chain.