

Step 1 – Generation of 3D Model from High Resolution Images
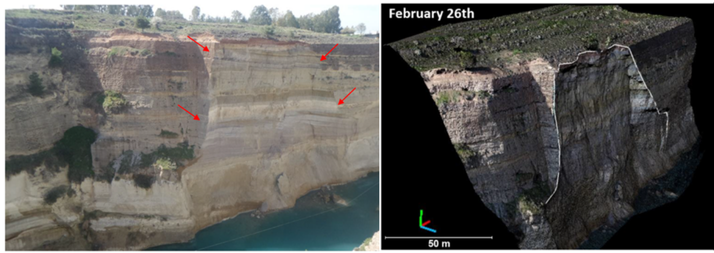
Two drone surveys flown in March 2018 captured approximately 600 oblique high-resolution images of the Corinth Canal slope. The images were processed to generate 3D models of the steep side slopes of the canal.
Step 2 – Structural Mapping using ShapeMetriX
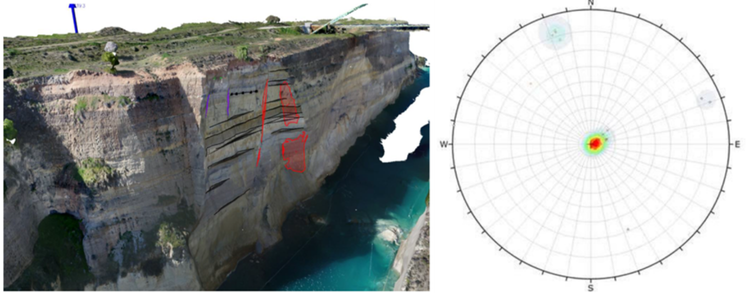
From the 3D photogrammetric models, the geometry of faults and discontinuity sets at the failure zone were mapped using ShapeMetriX. Stereographic projection of the discontinuity orientations confirmed the kinematic feasibility of block failure. The mean orientations of the discontinuities identified were faults (71°/149°), near-vertical joints (80°/163°), and gently dipping bedding planes (6°/272°).
Step 3 – Back-Analysis of Failed Block using RocPlane and Slide3
The failure block was determined to be a long pillar bounded laterally by a fault and joint surface. The analysis assumed a planar slide along the marl base, with a tensile crack at the rear scarp.
According to the back analysis, the shear strength of the marl at the base of the failed block was determined as follows and no shear strength was attributed to the back scarp tensile surface.
Shear Strength Parameters
- Base of failed block (marl): c′ = 150 kPa, ϕ′ = 35°
- Initial analysis using RocPlane (2D planar stability analysis) yielded a Factor of Safety of 1.0 for the failed block. The calculated block weight of 13,350 tn (267 tn/m at γ=2.0 tn/m³) closely matched the 12,000 tn volume from photogrammetric scans.
The failure of February 26, 2018 as demonstrated in the planar sliding back analysis was three-dimensional in nature and had both geological structure and rock mass components, as in the majority of rock slope failures. Therefore, to better represent the three-dimensional characteristics of the failure, 3D limit equilibrium back analysis was utilized.
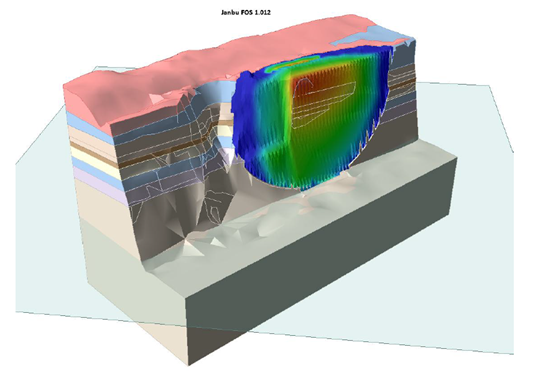
Detailed Slide3 (3D limit equilibrium analysis) analysis, using ellipsoidal slip surfaces and different methods of columns calculation algorithms (Bishop, Janbu, Spencer, GLE), all yielded identical failure surfaces and FOS≈1.0.

Why use ShapeMetriX and Slide3 in Your Next Slope Stability Analysis
The Corinth Canal case study demonstrates that for mapping high-risk slopes or evaluating failure mechanisms, UAV-enabled mapping coupled with 3D modelling provides a faster, safer, and more accurate method of stability analysis.
For projects like the Corinth Canal, where relaxation, strength degradation and heavy rainfall induced water pressures threaten stability, these tools are no longer optional—they are essential.
Start a free ShapeMetriX or Slide3 trial today!
Source: Saroglou et al. (2018). Analysis of slope instabilities in the Corinth Canal using UAV-enabled mapping. ICONHIC Paper 304.